Make Me Static - Live WebStats

Live WebStats is a new feature that we’ve just added to the Pages platform. It provides a real-time (or live) view of what’s happening on your website in terms of visitors. It’s relatively feature complete but expect a little more polish over time. As this feature is a part of our Pages platform it is only available if you select the default Git option. If you choose to use GitLab and your own Pages provider, this WebStats option will not be available.
What is It?
An slightly technical explanation of what the LiveStats service is and what it does
How do I make it work for my Site?
What you need to do to get it up and running
What does all this mean?
An explanation of some of the statistical content and how it can be useful to you
Changing the Dashboard view
The display has many display options depending on what it is you want to monitor
What is It?
Typically there are two different ways to log website usage. One of referred to as client-site, which involves inserting cookies and / or Javascript into your web pages and having the browser send information to some central server somewhere in the cloud.
Although problematic from the perspective of GDPR and ad-blockers (which may try to stop this logging from happening), because WordPress tends to lean heavily on caching, it’s generally the best way to get hold of the most accurate information regarding visitors to a site. (anything running inside the browser is absolute and not something caching generally interferes with)
Server-side logging is what people used to use before the advent of caching and third party reverse proxies like CloudFlare. This is far less intrusive, it does not require your pages to be modified or to have each page phone home. As such it’s not subject to being blocked by ad-blockers or privacy complaints resulting from the use of cookies or websites sending information back to unknown central servers.
We are using server-side logging which works for us because;
- We are running the web servers that actually serve up the pages
- Static Pages do not need complex caching systems which can interfere with this approach
So no cookies are used, no phoning home happens, the logging information comes directly from the web server itself when a browser makes a request against it. Each request results in the web server sending a log record on to our Logging server.
The Logging server runs each incoming record through some Open Source software that analyses the data, indexes it, then stores the resulting information in a very fast database. It then works out what’s changed and sends the new statistics out via a secure websocket to anybody who has the LiveStats page open for that particular site. This information then updates the viewer’s page in-situ. (includes all charts and data tables)
The time between the server sending a page response back to a web browser and the resulting log record updating the charts and graphs for someone watching is typically between 0.5s and 2s.
The Open Source software doing the heavy lifting here is called GoAccess.
How do I make it work for my Site?
There are only two pre-requisites for getting the Live Web Stats to work for you, these are;
- You need to select the Default Git option (which the setup Wizard will do for you) which means you will be using our Pages platform.
- You need to point a real domain name at your static copy. When you initially generate your static copy it will be visible using a unique URL automatically generated for you. We do not generate Web Stats for these URLs. Once you assign a real domain name to the site, it should automatically pick up on this and start generating Live Stats information, probably with 10-15 seconds of the first user hitting your new URL.
To activate the Live Stats display, click on the Green Live Stats button to the far right of your profile entry;

If this button is disabled, it means either you’ve not successfully deployed a static copy, or you don’t have a real domain pointing at your static copy. The Live Stats display should appear under the Profiles listing.
To hide the Live Stats display, click on the same button.
What does all this mean?
This section will run through the main components of the Dashboard view and try to explain what they represent and what (if anything) they can be used for.
Note: the servers work in UTC and currently we do not have localisation in place. So be aware, if you are based outside of the UK, or inside the UK and daylight savings are in operation, the times shown may look a little ‘off’. Servers always record in UTC, what we need is the ability to select a timezone in the Plugin’s profile setup, we’re just not quite there yet.
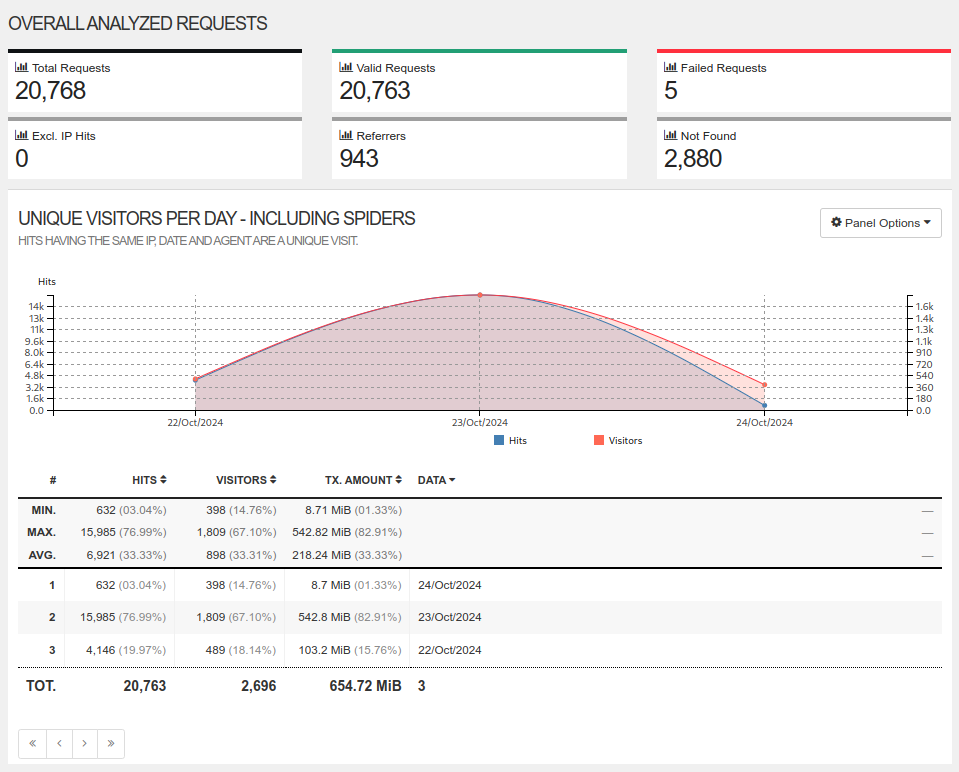
Unique Visitors per Day
This chart shows a day by day representation of how many visitors there have been to the site, and how many requests were made against the server for that site per day. Obviously the number of visitors is a useful number, but the difference between the number if visitors and the number of hits tells you how many requests a browser is making on average to deliver one page. This should give you an indication of how efficient the site is and how fast it responds to users.
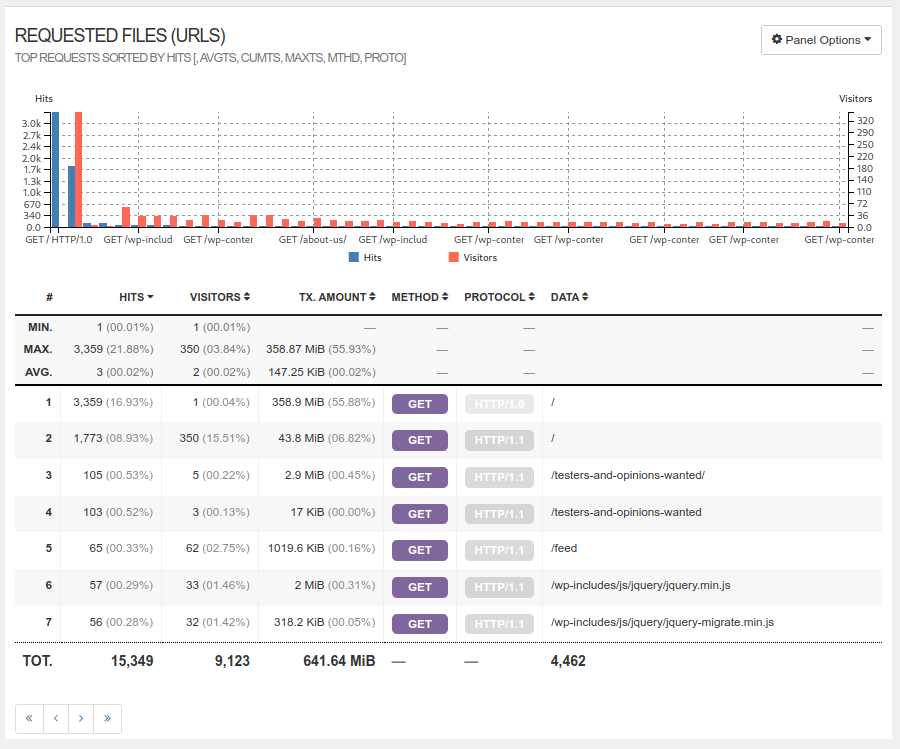
Requested Files
Shows which files are being requested and how often. Note that you can click on the table headings to sort by a column in either ascending or descending order. It’s always useful to know which pages are being viewed the most, but also if non-pages are being hit frequently (.css, .js, images etc) then performance can often be improved by handing these off to a CDN.
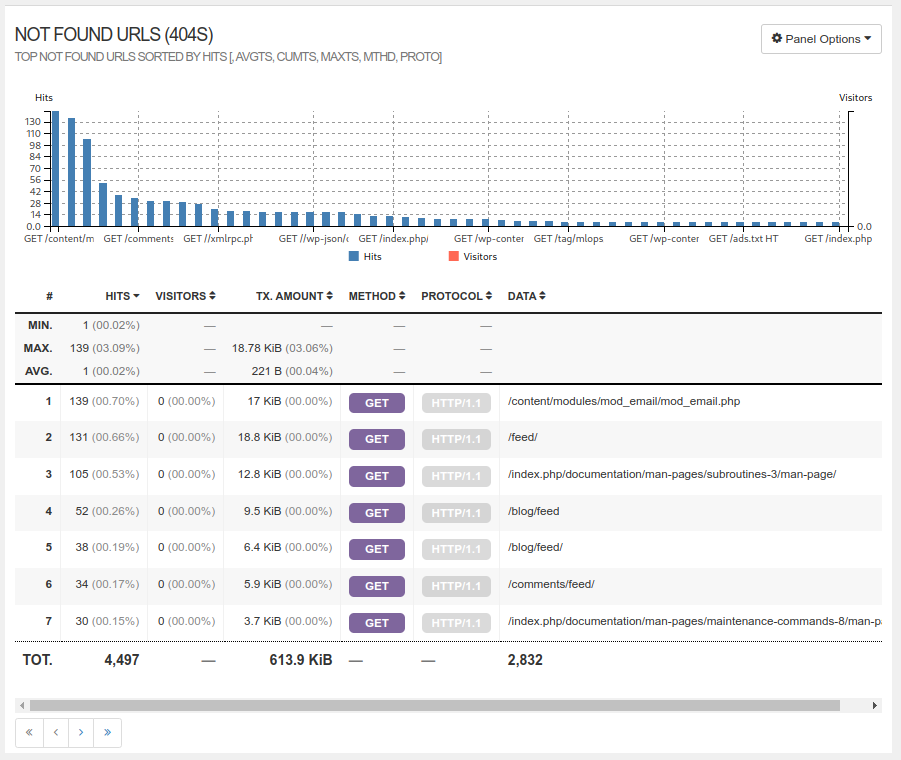
Not Found URLs
These are requests that were made for files that don’t exist. If the file should exist then this table is quite useful for identifying problems. If somebody is (potentially repeatedly) trying to access a file that should not exist (and doesn’t) this is often a sign that someone is looking for an exploit or a file that has been compromised on other systems.
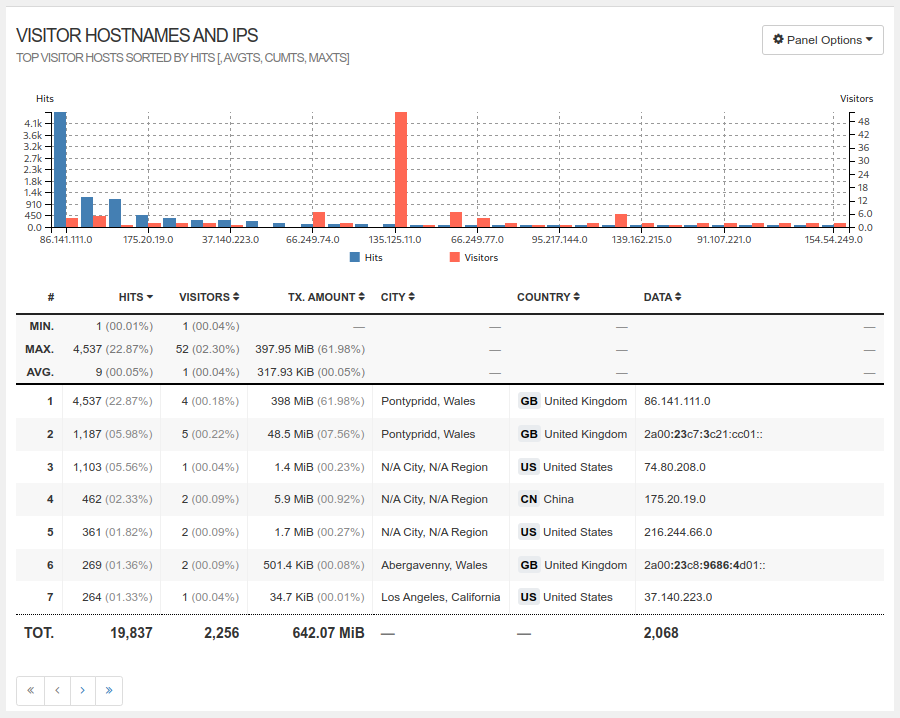
Visitor Hostname and IPS
This table and chart represent the top users of your site in terms of hits and visitors. Again sorting the columns can provide interesting insights, whereas you might expect the number of visitors from a given location to be one or maybe two, a larger number can either indicate many people from one company, or someone coming back to the site repeatedly, but with a sufficient time period between sessions to make it look like a new visit each time. Very large numbers of hits can indicate potential abusers or web crawlers which are a little on the ‘heavy’ side. Note that the actual addresses are partially anonymised which allows for analysis by geographical region, but not by user.
Operating Systems
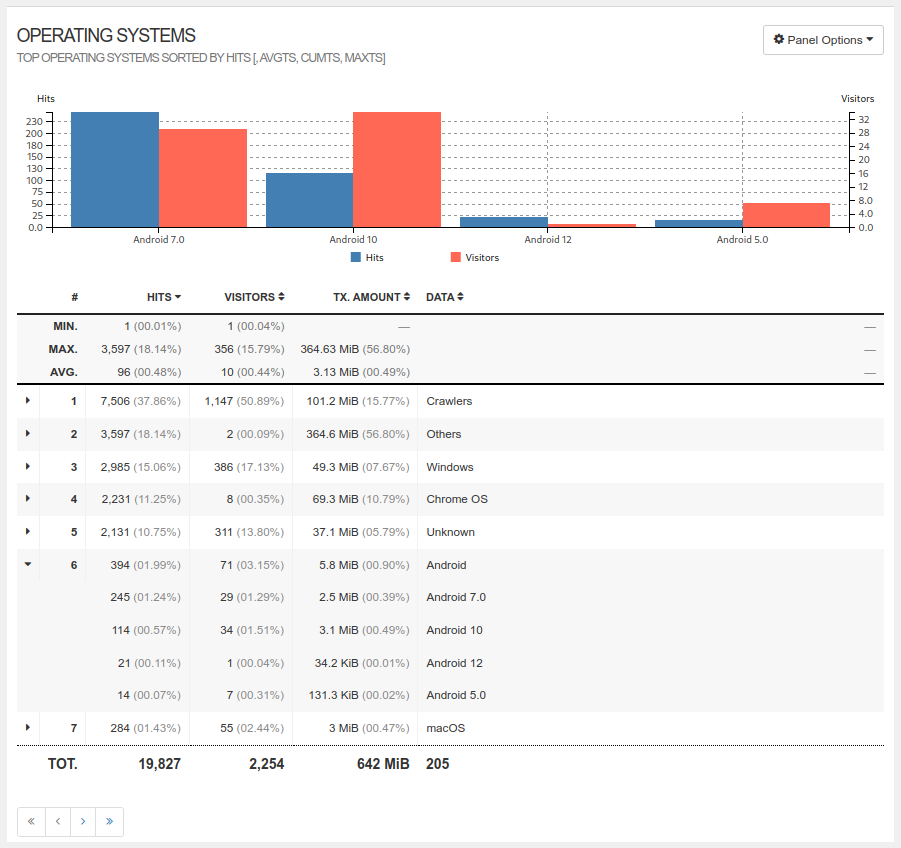
Just what it says on the tin, it’s often possible to glean which Operating System a user is running on from the requests made by the browser. This table is a summary of the information the system has been able to derive. Note the triangle next to each entry, if you click on this it will open up more detail which is typically a breakdown of the Operating System by version. Often an insight in the type of users using the site. Not that opening a triangle with re-focus the chart on the break-down information.
Browsers
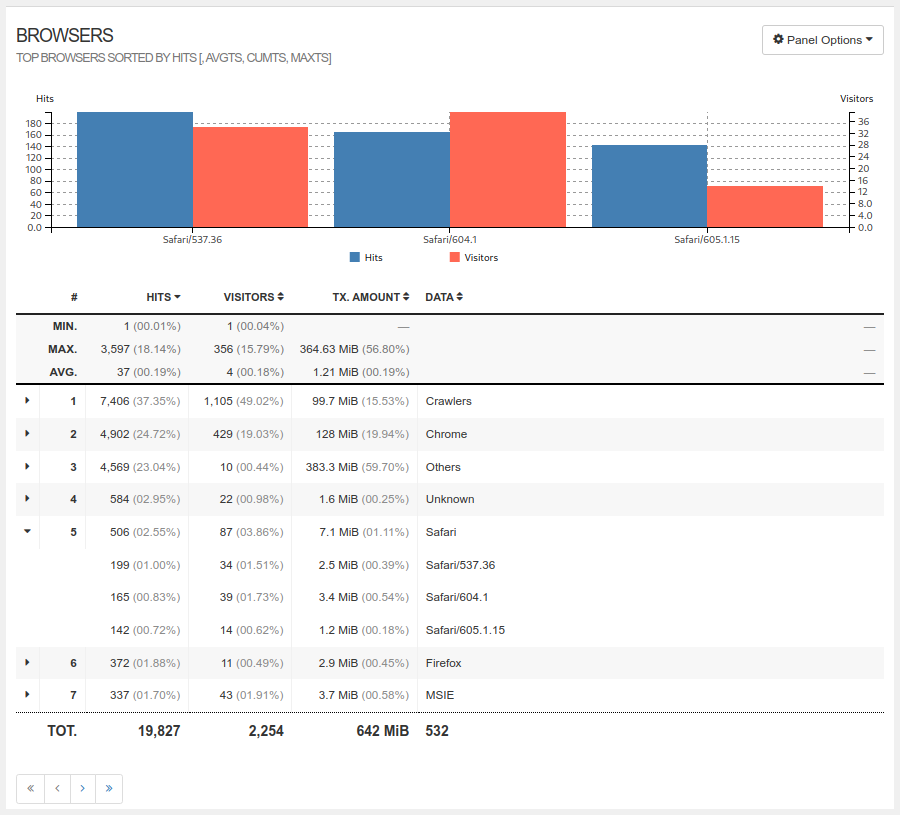
As with Operating Systems, a breakdown of the different types of browser people are using. Again clicking the triangle will break each entry down by version. Useful from a development perspective as it gives you an idea about how important compatibility is with different type of browser, or indeed whether support for certain browsers is needed for the site.
Time Distribution
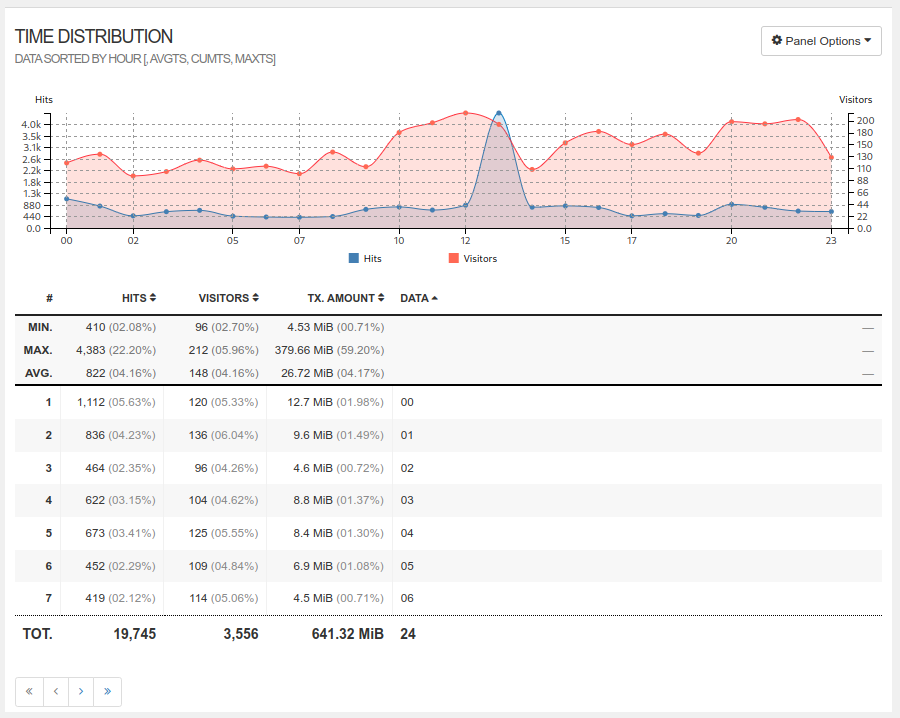
Hits and Visitors per hour throughout the day. Useful indicator as to when busy periods for the site are. Don’t be caught out wondering why visitor numbers exceed hits, there are two Y-axis scales 😉
Referrer URLs
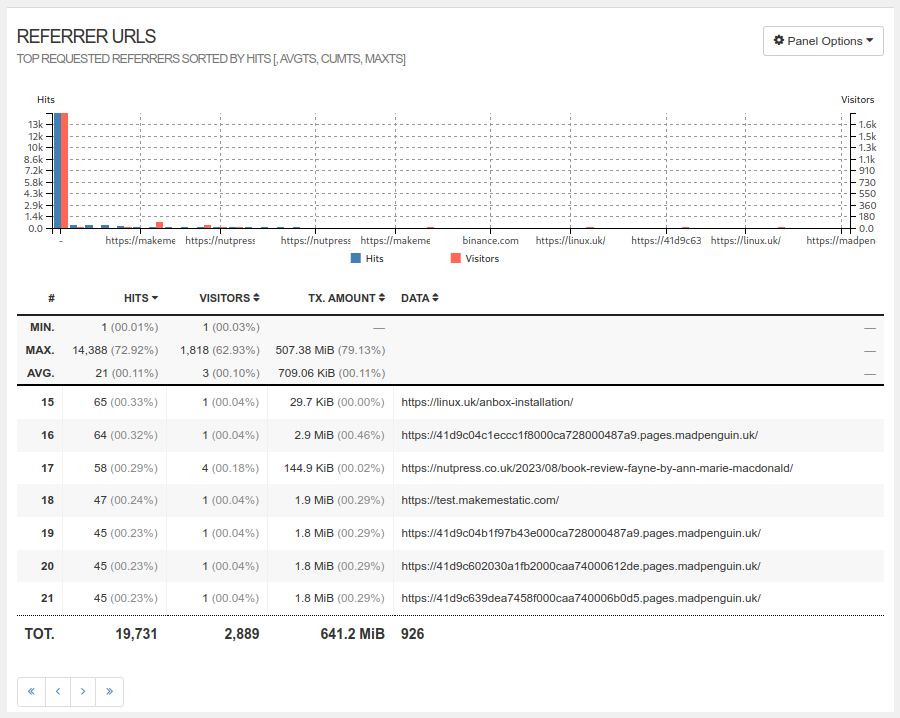
When you’re on a site and click on a link, the address that contained the link you clicked on ends up being sent to the link you click on. So when a server receives a request that was linked from another site, the server knows the address of the page that the request was linked from (!)
This is know as the referrer and is a useful indication of how people are reaching your site. A “-” indicates that someone either typed in a URL, pasted in a URL, or used a bookmark to reach you. (or it was a crawler that didn’t supply a referrer reference)
Anything else indicates the address of another site with a link to this site. A referrer of www.google.com for example would indicate the number of times someone reached your site by clicking on a google search result.
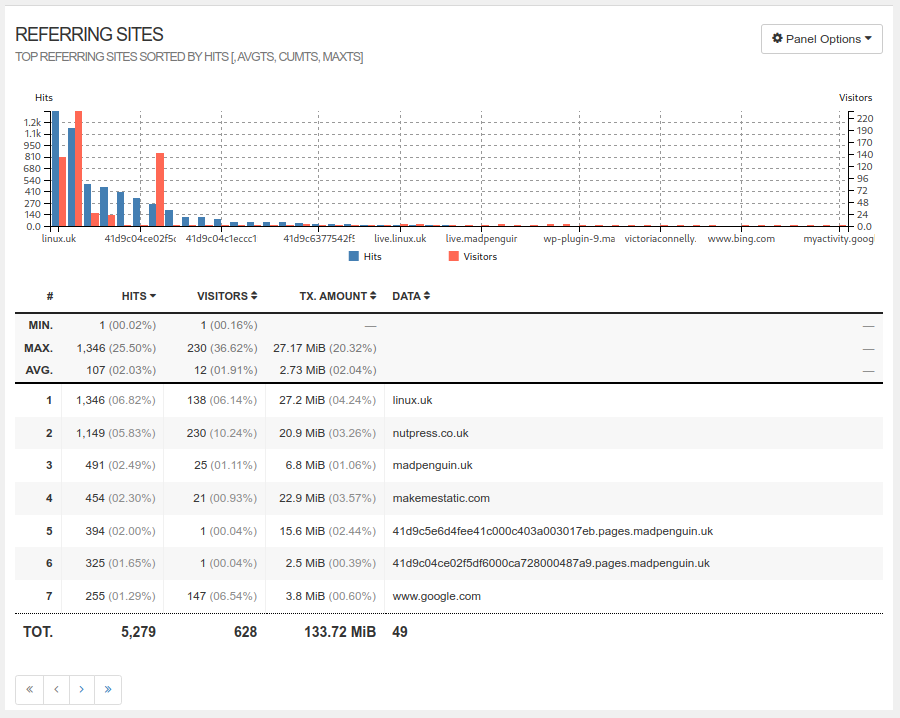
Referring Sites
As with Referrer URL’s, but this lists the referrers grouped by site, rather than URL. So Referrer URL’s will give you pages that link to your site, but referring sites lists all the sites that contain pages that link to your site. So you might find one site has a number of specific links to your site, which would result in one entry in Referring Sites and multiple entries in Referring URL’s.
HTTP Status Codes
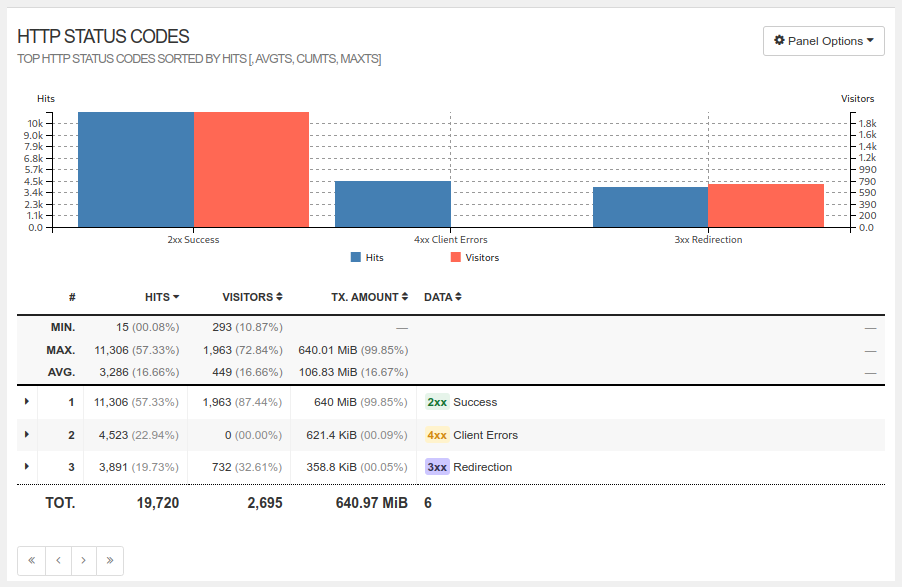
Very useful for spotting potential problems. You can lookup “HTTP codes” on Google for more detail on codes, but in summary;
- 2xx – Good, request was serviced as expected
- 3xx – Ok, request was redirected which is probably Ok
- 4xx – Page not delivered, either a non-existant page was requested, or a page is missing (or a link is ‘broken’)
- 5xx – The server is unhappy, visitors are potentially not getting pages they should
GEO Location
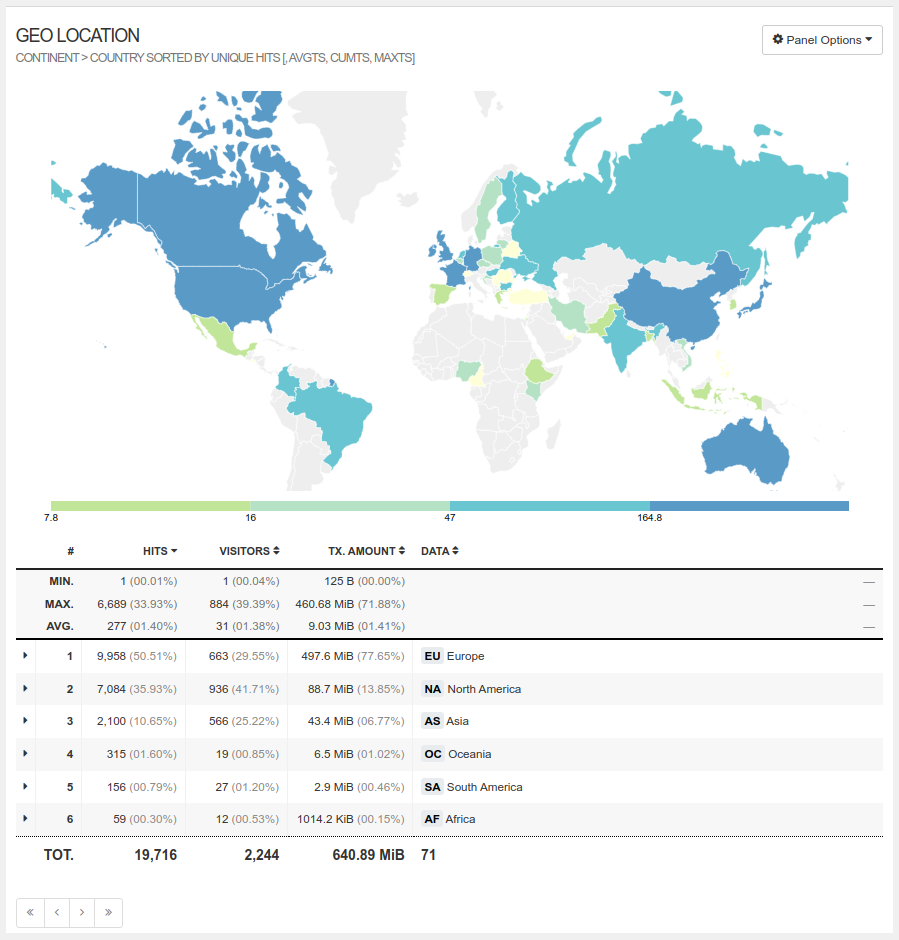
Gives an idea of which parts of the World your site visitors are coming from. Can be useful in many ways, if you see lots of traffic from a far-off location (for example) for something that’s very “local”, it might be an indication of someone looking for exploits or potentially abusing the site in other ways.
Changing the Dashboard view
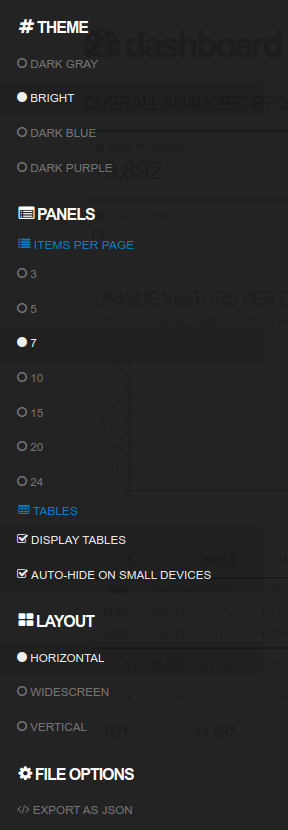 The default configuration of the Dashboard is designed to be a starting point for your preferred view of the Live Stats information. Depending on how you choose to view and use the information, the expectation is that you will want to tweak the view in some way.
You can change the view by clicking on the Options link at the top left of the Live Stats view. This will open a drop-down menu from which you can make changes. The headline changes you may wish to play with;
- Theme, probably not something you want to change as the default is designed to fit with the look and colour scheme of the Plugin and WP Dashboard, however if the screen is too bright then there are three “dark” options to choose from.
- Items Per Page, maybe not so intuitive but it refers to the numbers of rows that appear in the tables under the chart. To see more rows, increase this number.
- Display Tables, untick this box and only the charts will be shown
- Layout, the default is Horizontal which displays in two columns. For older monitors this is probably about right. If you have a newer 4k Monitor (or better) then you might find WideScreen useful as this displays in four columns meaning you can see more without scrolling. If you just want one column you can select Vertical which gives some fairly large charts and tables.
Once you make a change in your browser, it is persistent. Next time you come back to the stats for this site it will have remembered your choices. If you need to reset your choices they are stored in your browser’s local storage. To clear your choices;
- Open the delveloper tools window in the browser
- Click on Application
- Select Local storage on the left
- Select the URL for your site
- In the middle pane, select AppPrefs
- Right click, then Delete
- If you reload the page it should now be set back at the default options
